Readable and Interactive Graph of the Individuals of a Principal Component Analysis
Source:R/pca.R
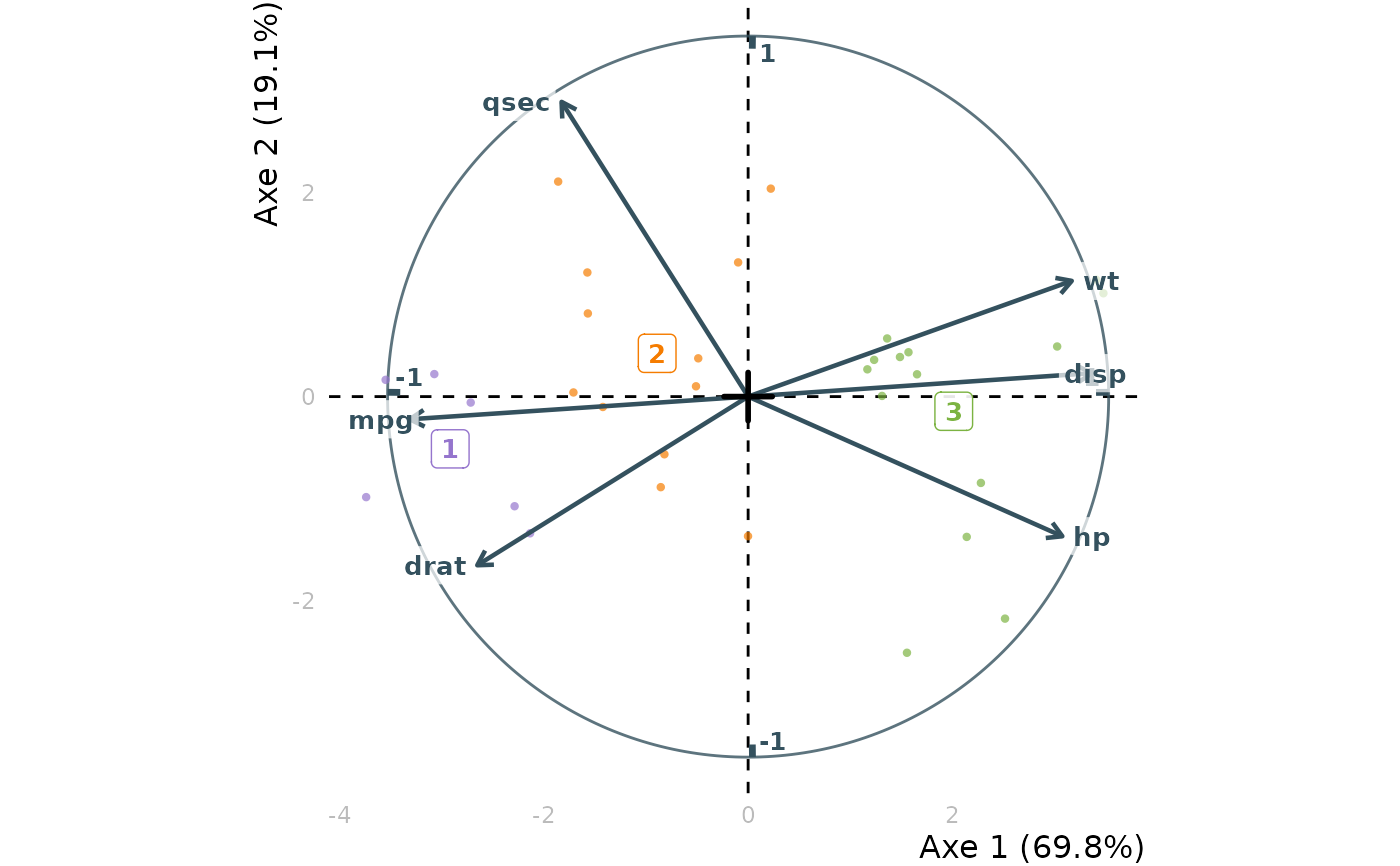
ggpca.RdThe biplot of a principal component analysis: the cloud of its individuals in the
plane of two axes, the levels of supplementary variables at the barycentre of their individuals,
the clusters of hierarchical_clust coloured, and the active variables as arrows,
the circle of correlations rescaled onto the cloud. Only the DIRECTION of an arrow reads there:
an individual lies towards the variables it scores high on; the length of an arrow and the
distance between an arrow and an individual mean nothing, and ggpca_cor_circle
draws the correlations at their own scale. Hovering an individual shows its value on each active
variable; hovering a supplementary level shows the mean of each active variable among its
individuals, coloured by its standardized difference from the population's (blue above, red
below), as clust_tab does. ggfacto draws it for a principal
component analysis, unless `profiles = FALSE` leaves nothing but the circle.
Usage
ggpca(
  res.pca,
  data,
  sup_vars,
  axes = c(1, 2),
  axes_names = NULL,
  axes_reverse = NULL,
  type = c("text", "labels", "points", "facets"),
  color_groups = "^.{0}",
  clust_color_groups = "^.+$",
  keep_levels,
  discard_levels,
  cleannames = TRUE,
  profiles = TRUE,
  clust,
  max_profiles = 2000,
  alpha_profiles = 0.7,
  color_profiles = TRUE,
  base_profiles_color = "#bbbbbb",
  text_repel = TRUE,
  title,
  sup_in_italic = TRUE,
  ellipses = NULL,
  xlim,
  ylim,
  out_lims_move = FALSE,
  shift_colors = 0,
  colornames_recode,
  scale_color_light = material_colors_light(),
  scale_color_dark = material_colors_dark(),
  text_size = 3.5,
  size_scale_max = NULL,
  dist_labels = c("auto", 0.04),
  right_margin = 0,
  use_theme = TRUE,
  get_data = FALSE,
  lang = NULL,
  variables = TRUE
)
Arguments
- res.pca
An analysis made with
principal_component_analysisorFactoMineR::PCA().- data
The data frame the analysis was made on, in which to find the supplementary variables and the clusters: the whole data frame, even when the analysis was made on a subset of it. Only needed with `sup_vars` or `clust`.
- sup_vars
<tidy-select> The supplementary variables, as in `tab()`: each level is drawn at the weighted barycentre of its individuals.
- axes
The axes to print, as a numeric vector of length 2.
- axes_names
Names of all the axes (not just the two selected ones), as a character vector.
- axes_reverse
Possibility to reserve the coordinates of the axes by providing a numeric vector : `1` to invert left and right ; `2` to invert up and down ; `1:2` to invert both.
- type
Determines the way
sup_varsare printed:"text","labels","points", or"facets"(one graph of the individuals of each level of the firstsup_vars).- color_groups
By default, there is one color group for all the levels of each `sup_vars`. It is possible to color `sup_vars` with groups created upon their levels, with a regex matched against each level name (the groups are printed in the console with `options(ggfacto.verbose = TRUE)`). For exemple, `color_groups = "^."` makes the groups upon the first character of each levels (uselful when their begin by numbers).
color_groups = "^.{3}"upon the first three characters.color_groups = "NB.+$"takes anything between the `"NB"` and the end of levels names, etc.- clust_color_groups
Color groups for the `clust` variable (the clusters).
- keep_levels
A regex, or a vector of them, matching the supplementary levels to keep: the others are discarded.
- discard_levels
A regex, or a vector of them, matching the supplementary levels to discard.
- cleannames
Set to
TRUEto clean levels names, by removing prefix numbers like"1-", and text in parentheses.- profiles
By default the individuals are drawn: `FALSE` draws the supplementary levels and the variables alone.
- clust
The variable of `data` holding the clusters, typically made with
hierarchical_clust: the individuals of one cluster are coloured alike and linked at mouse hover.- max_profiles
The maximum number of individuals to draw: the heaviest first, and, among individuals of equal weight, an evenly spread sample.
- alpha_profiles
The alpha (transparency, between 0 and 1) for profiles of answer.
- color_profiles
By default, if
clustis provided, profiles are colored based on clust levels (HCPC clusters). Set doFALSEto avoid this behaviour. You can also give a character vector with only some of the levels of the `clust` variable .- base_profiles_color
The base color for answers profiles. Default to gray. Set to `NULL` to discard profiles. With `color_profiles`, set to `NULL` to discard the non-colored profiles.
- text_repel
By default, labels are moved so that they do not overlap, with
ggrepel::geom_text_repel. Set toFALSEto print each label exactly at its point, which is faster to draw.- title
The title of the graph.
- sup_in_italic
Set the supplementary levels in italics, as in every graph of the package. `FALSE` sets them upright.
- ellipses
Set to a number between 0 and 1 to draw a concentration ellipse for each level of the first
sup_vars.0.95draw ellipses containing 95 individuals of each category.0.5draw median-ellipses, containing half the individuals of each category. Every individual counts, whether or not `profiles = TRUE`.- xlim, ylim
Horizontal and vertical axes limits, as double vectors of length 2.
- out_lims_move
When
TRUE, the levels out ofxlimorylimare not removed, but moved to the edges of the graph.- shift_colors
Change colors of the
sup_varspoints.- colornames_recode
A named character vector with
fct_recodestyle to rename the colour groups. They are printed in the console with `options(ggfacto.verbose = TRUE)`.- scale_color_light
A scale color for sup vars points
- scale_color_dark
A scale color for sup vars texts
- text_size
Size of text.
- size_scale_max
The size of the largest point. By default, computed from the spread of the weights of the points drawn, so that the median answer profile stays visible.
- dist_labels
When
type = points, the distance of labels from points.- right_margin
A margin at the right, in cm. Useful to read tooltips over points placed at the right of the graph without formatting problems.
- use_theme
By default, a specific
ggplot2theme is used. Set toFALSEto customize your owntheme.- get_data
Returns the data frame to create the plot instead of the plot itself.
- lang
NULL(the session's language),"en"or"fr": the language of the tooltips and of the axis titles.- variables
By default the active variables are drawn as arrows. Set to `FALSE` to draw the individuals alone.
Value
A ggplot object, to which elements can be added with
+. Sending it through ggi draws the interactive graph.
Examples
# \donttest{
cars <- mtcars
cars$cyl <- factor(cars$cyl)
res.pca <- principal_component_analysis(cars, c(mpg, disp, hp, drat, wt, qsec))
ggpca(res.pca, cars, sup_vars = cyl) |>
ggi()
cars <- cars |>
dplyr::mutate(clust = hierarchical_clust(res.pca, ncp = 2, nb_clust = 3))
ggpca(res.pca, cars, clust = clust)
 # }
# }