Plot Initial Dimensions (Active Variables) of Multiple Correspondence Analysis
Source:R/mca-teach.R
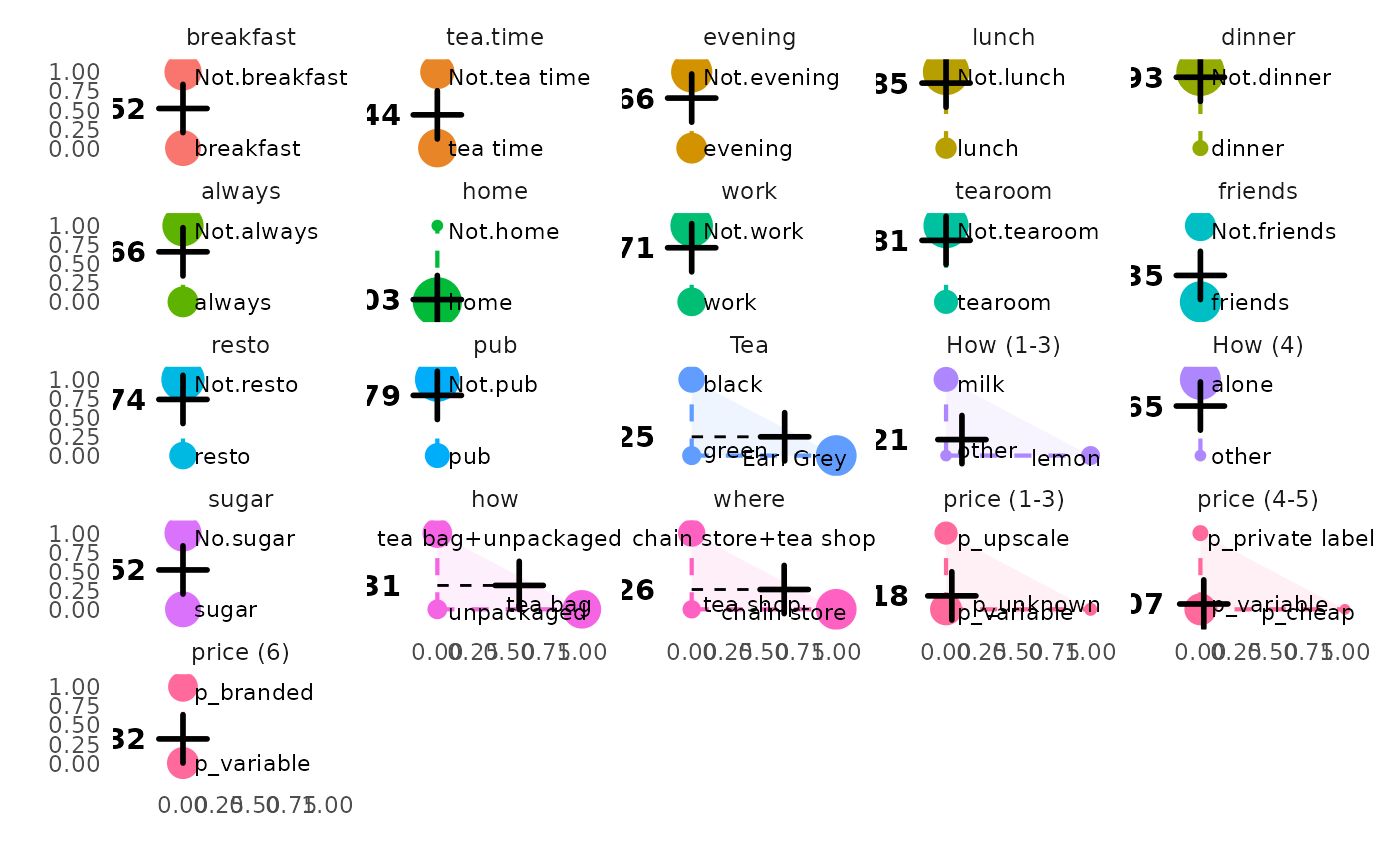
ggmca_initial_dims.RdThis function mostly have an educational value : it shows the
initial dimensions of the Multiple Correspondence Analysis (active variables)
in their initial reference frame. It shows the n dimensional space before the
analysis is done. To see initial dimensions axes in the space built by the
analysis (principal axes), use ggmca_with_base_ref.
Usage
ggmca_initial_dims(
  res.mca,
  data,
  proj_just = c(1.5, 2),
  cleannames = TRUE,
  keep = NULL
)
Arguments
- res.mca
An object created with
multiple_correspondence_analysisorFactoMineR::MCA.- data
The data frame the analysis was made on. Optional: the analysis keeps its levels in the data's order. It is accepted so that every `ggmca_*` function takes `(res.mca, data)`.
- proj_just
Horizontal justification of text of the coordinates on axes, as a character vector of length 2 (x and y).
- cleannames
Set to
TRUEto clean levels names, by removing prefix numbers like"1-", and text in parentheses.- keep
A character vector of the name of active variables to keep.
Value
A ggplot object to be printed in the
`RStudio` Plots pane. Possibility to add other gg objects with +.
Sending the result through ggi will draw the
interactive graph in the Viewer pane using girafe.
Examples
# \donttest{
data(tea, package = "FactoMineR")
res.mca <- multiple_correspondence_analysis(tea, 1:18)
ggmca_initial_dims(res.mca, tea)
 # }
# }